Basics
Business Intelligence with Power BI
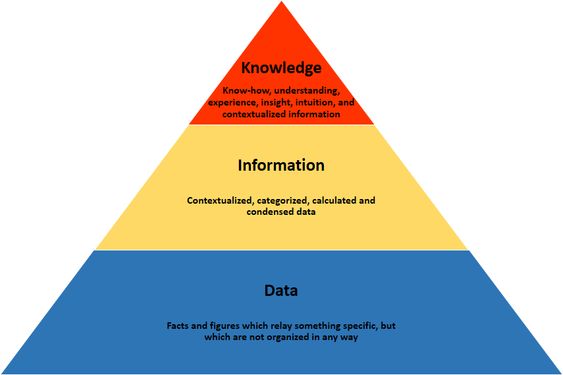
Business Intelligence: It's the ability to transform data and information, and in turn, this information into knowledge, to speed up time in terms of decision-making
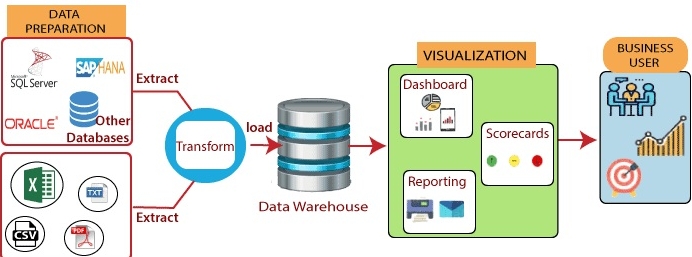
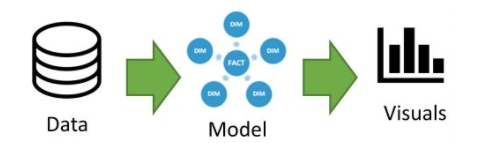
BI Flow
ETL
Data extraction from data sources
Data transformation (source consolidation, cleaning and transformation of data)
Data load into Power BI data warehouse
Tools: PowerCenter, SQL Server Integration Services (SSIS), Oracle Data Integrator (ODI), Power Query (in Power BI)
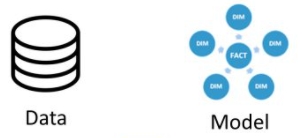
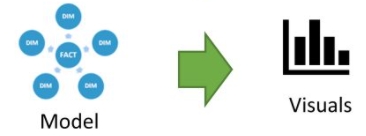
Modeling
Relationships
KPI's
Optimization (to answer all business questions)
Tools: Erwin Data Modeler, PowerDesigner (SAP modeling tool), Power Pivot (in Power BI)
Data Warehouse: Usually serves as the central database of a company or, in other words, the database where all the useful data of an organization is stocked
Data Mart: Stores concise and specific data sets used for analysis for a specific department or line of business, such as the sales department
Reporting (putting into operation):
Data visualization
Reports
Dashboards
Storytelling
Tools: Power BI, Qlik, Tableau, and so on
Dashboard: A data dashboard is a businesses tool used to help track, analyze, and display data, usually to gain deeper insight into the overall wellbeing of the organization, a department, or even a specific process. In Power BI, it corresponds to the report
Balanced scorecard: It's a tool for monitoring the strategic decisions taken by the company based on indicators previously established and that should often permeate through at least four aspects – financial, customer, internal processes, and learning & growth -. In Power BI, it corresponds to the dashboard
Power BI: It's an integral and comprehensive Business Intelligence solution that provides a detailed view of the most critical data within an organization
Business Suite
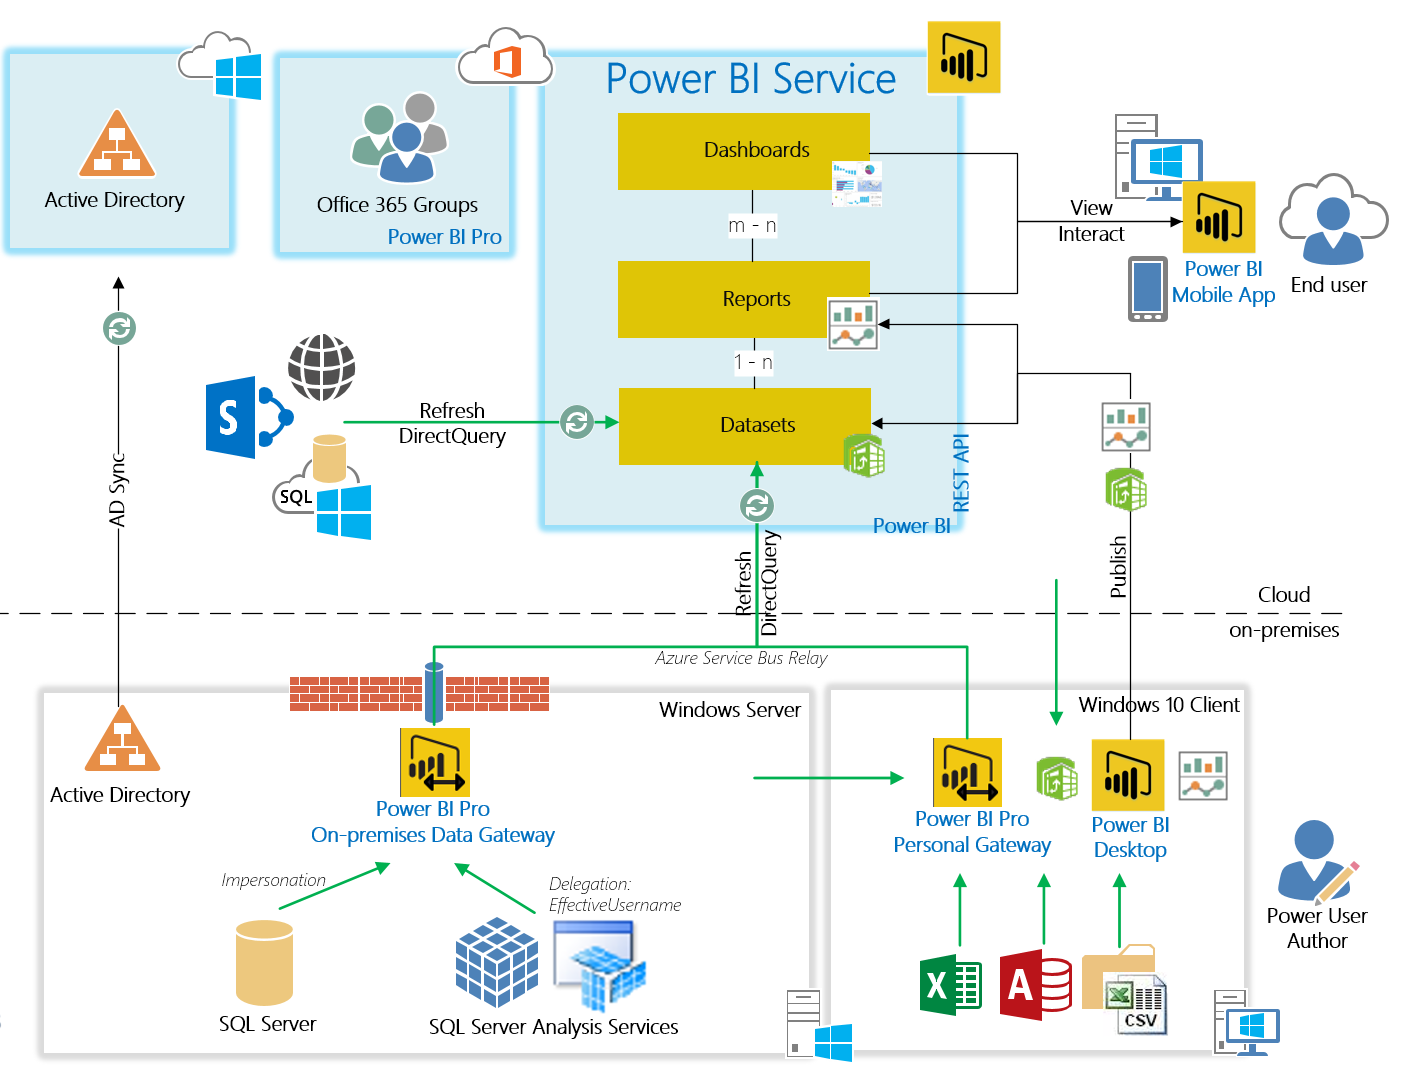
Power BI Desktop: Desktop tool oriented to the development environment, which allows us to connect to various data sources and create reports
Power BI Service: Service in the cloud that allows us to establish the entire collaborative environment
Power BI Mobile: Mobile application that allows us to view and interact with a report from any mobile device (Android & Apple)
Power BI components
Power Query ETL: Extraction, transformation, and loading of data
Power Pivot (DAX) Modeling: Answer all business questions
Power BI architecture
Power BI Free architecture
Includes 1 GB of storage
Isn't possible to collaborate with other users simultaneously (reports, dashboards, and dataset), but it's possible to publish on websites (without security)
Report sharing is only possible in public mode (without security)
Power BI PRO architecture
Includes 10 GB of storage
Can be shared with internal users as long as they also have a PRO license
Optional gateway
Can actualize data up to 8 times per day
The creator (on Desktop), and user (on Service) must have got, each one, a license
Power BI PREMIUM architecture
Includes 100 TB of storage
Can be shared with internal users without requiring them to have Power BI PRO
Greater scalability and performance than shared capacity in Power BI Service
Can actualize data up to 48 times per day
The creator (on Desktop), and user (on Service) must have got, each one, a license
Notice: None of this can be started with a personal email account, but only with a business or with an educational email account
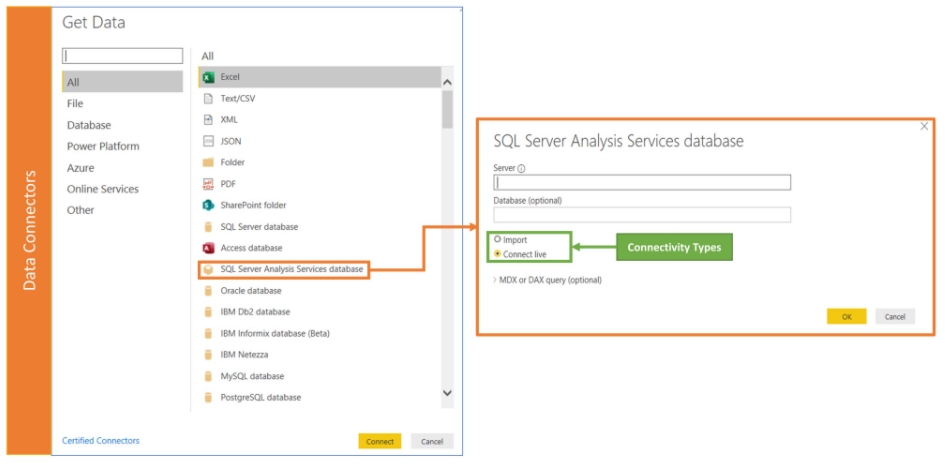
Connection types
Connection types
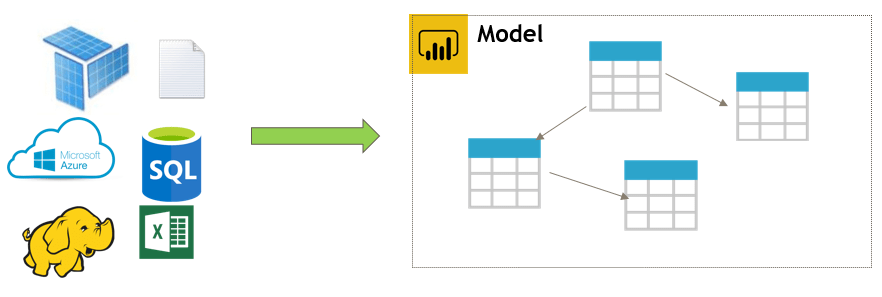
Power BI allows us to connect to a wide variety of data sources, from Excel files, SQL Server databases, websites, and so on
Connection types
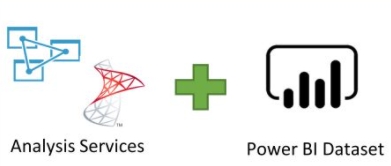
Live Connection or Dynamic: Read from SSAS or from a Power BI Service dataset, in other words, the data is stored outside Power BI (like Direct Query)
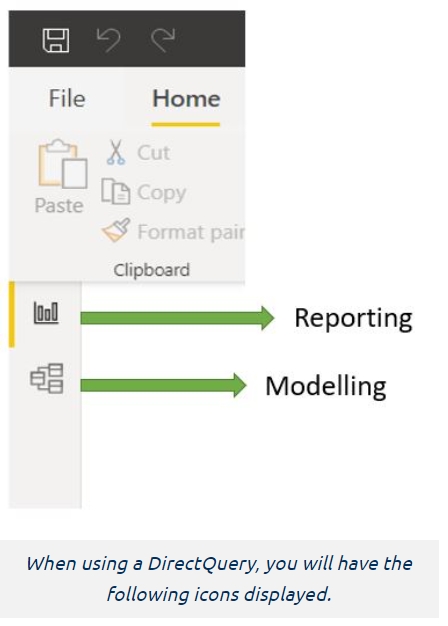
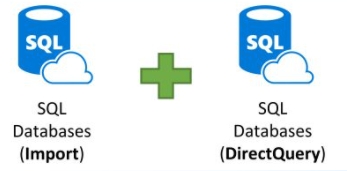
Direct Query: The data isn't copied since each interaction requests a query to the database
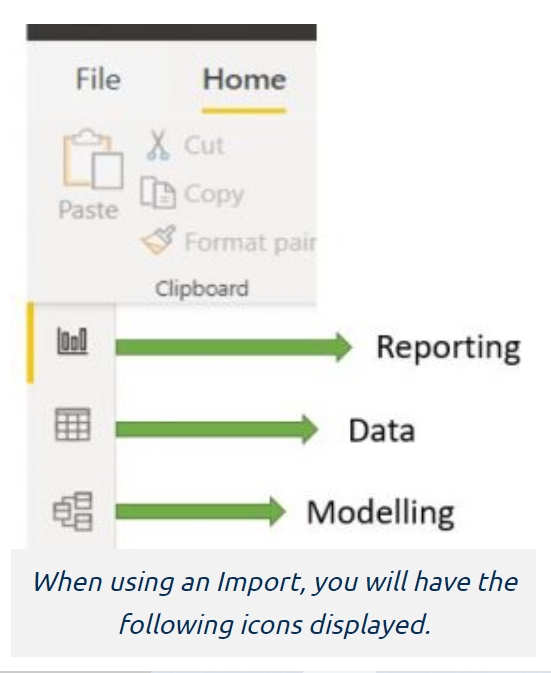
Import: The data is copied locally within the Power BI model (this is the most common type)
Composite Models: Combines Import and Direct Query technologies. It also allows us to use multiple datasets
Notices:
With Import connectivity, the PBIX file and the dataset are hosted in memory, it's the fastest of all connectivity types, but the Power BI dataset must be scheduled to refresh, and we should always keep our memory usage in mind. With PRO licensing, the Power BI dataset cannot exceed 1GB, however, with Power BI PREMIUM this can reach levels of 400GB
With DirectQuery connectivity, no data is ingested and stored in the Power BI model. Power BI will only store the metadata of the underlying data, therefore the table names, relationships, field names, etc., but not the actual data. By not storing any data in the Power BI model means we can store larger volumes of data and there's less chance that we'll run into any of the data volume limitations against the Power BI dataset, such as the 1GB dataset that comes with Pro licensing. DirectQuery is only available with database sources
In this connectivity model, queries will be generated and sent directly to the underlying data source to request data before displaying. The data remains on source side, near real time is available, and no scheduled refresh is required, but it can have an impact on the reporting consumers and on the performance of the underlying data source when too many users are generating queries at the same time. Power BI does have some Query Reduction methods to ease the number of queries to source
Using DirectQuery limits the capabilities of Power BI Desktop. For instance, Time-Intelligence DAX functions such as same period last year are not available for the purpose of limiting the complexity of queries sent to the underlying data source and some transformations in Power Query are restricted, such as removing duplicates and changing to some data types. Also, Power BI only allows DirectQuery to return 1M rows from the underlying data source unless we use Power BI PREMIUM
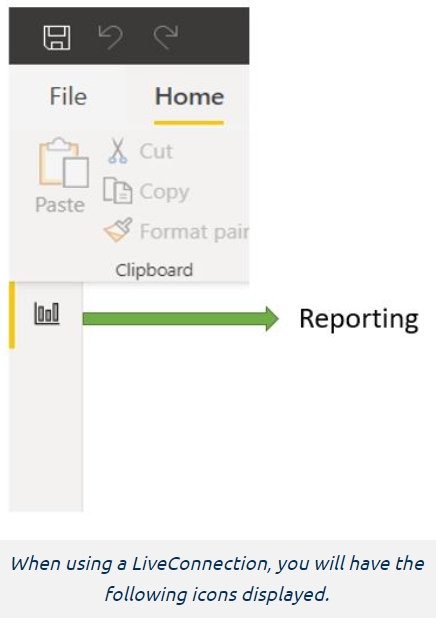
It is very common to find LiveConnection being confused with DirectQuery due to both connectivity types not storing any data in the Power BI model. However, they are two very different connectivity types, and they cannot be used interchangeably. Using a LiveConnection means no data is stored in the Power BI model, therefore all interaction with a report using a LiveConnection will directly query the existing Analysis Services model
LiveConnection can be used with SQL Server Analysis Services (Tabular models and Multidimensional Cubes), Azure Analysis Services (Tabular Models), and Power BI Datasets hosted in the Power BI Service. As these sources are analytical engines, the overall performance will be much higher compared to DirectQuery. Furthermore, all these sources can offer a semantic layer that acts as a single version of the truth, offering the business a golden layer of high integrity, well-governed data, therefore it's commonly used in enterprise deployments of Power BI, but only with named data sources
Using a LiveConnection does have some restrictions from an authoring perspective. However, as all the work has been done in Analysis Services or an existing Power BI dataset, we're simply taking advantage of an existing enterprise-level model, therefore it makes sense that restrictions exist on data transformation and data modeling capabilities. Also, some limitations exist on the DAX measures that can be written, as only Report Level Measures are available in it. This means the measures are stored in the Power BI report and not written back to the Analysis Services model. All reporting capabilities are available for use
A LiveConnection establishes a connection to a semantic layer such as Analysis Services or a Power BI dataset. In an enterprise scenario, it's important to have a semantic layer placed between your data source systems and Power BI, as it simplifies the data in the Data Warehouse by making it more usable for the business. Also, it aligns complex data with familiar business terms and removes the need to do any data preparation, therefore offering a complete & consolidated view across the organization
With the Composite connectivity models, we can combine data from multiple DirectQuery data sources and mix data from an Import data source. For instance, we can establish a DirectQuery connection to the sales fact table and multiple dimension tables from a SQL Data Warehouse and ingest data using an Import from an Excel spreadsheet that contains budget values. In the Power BI Desktop application, you'll notice the storage mode is set to Mixed in the bottom right, as the below shows
Last updated